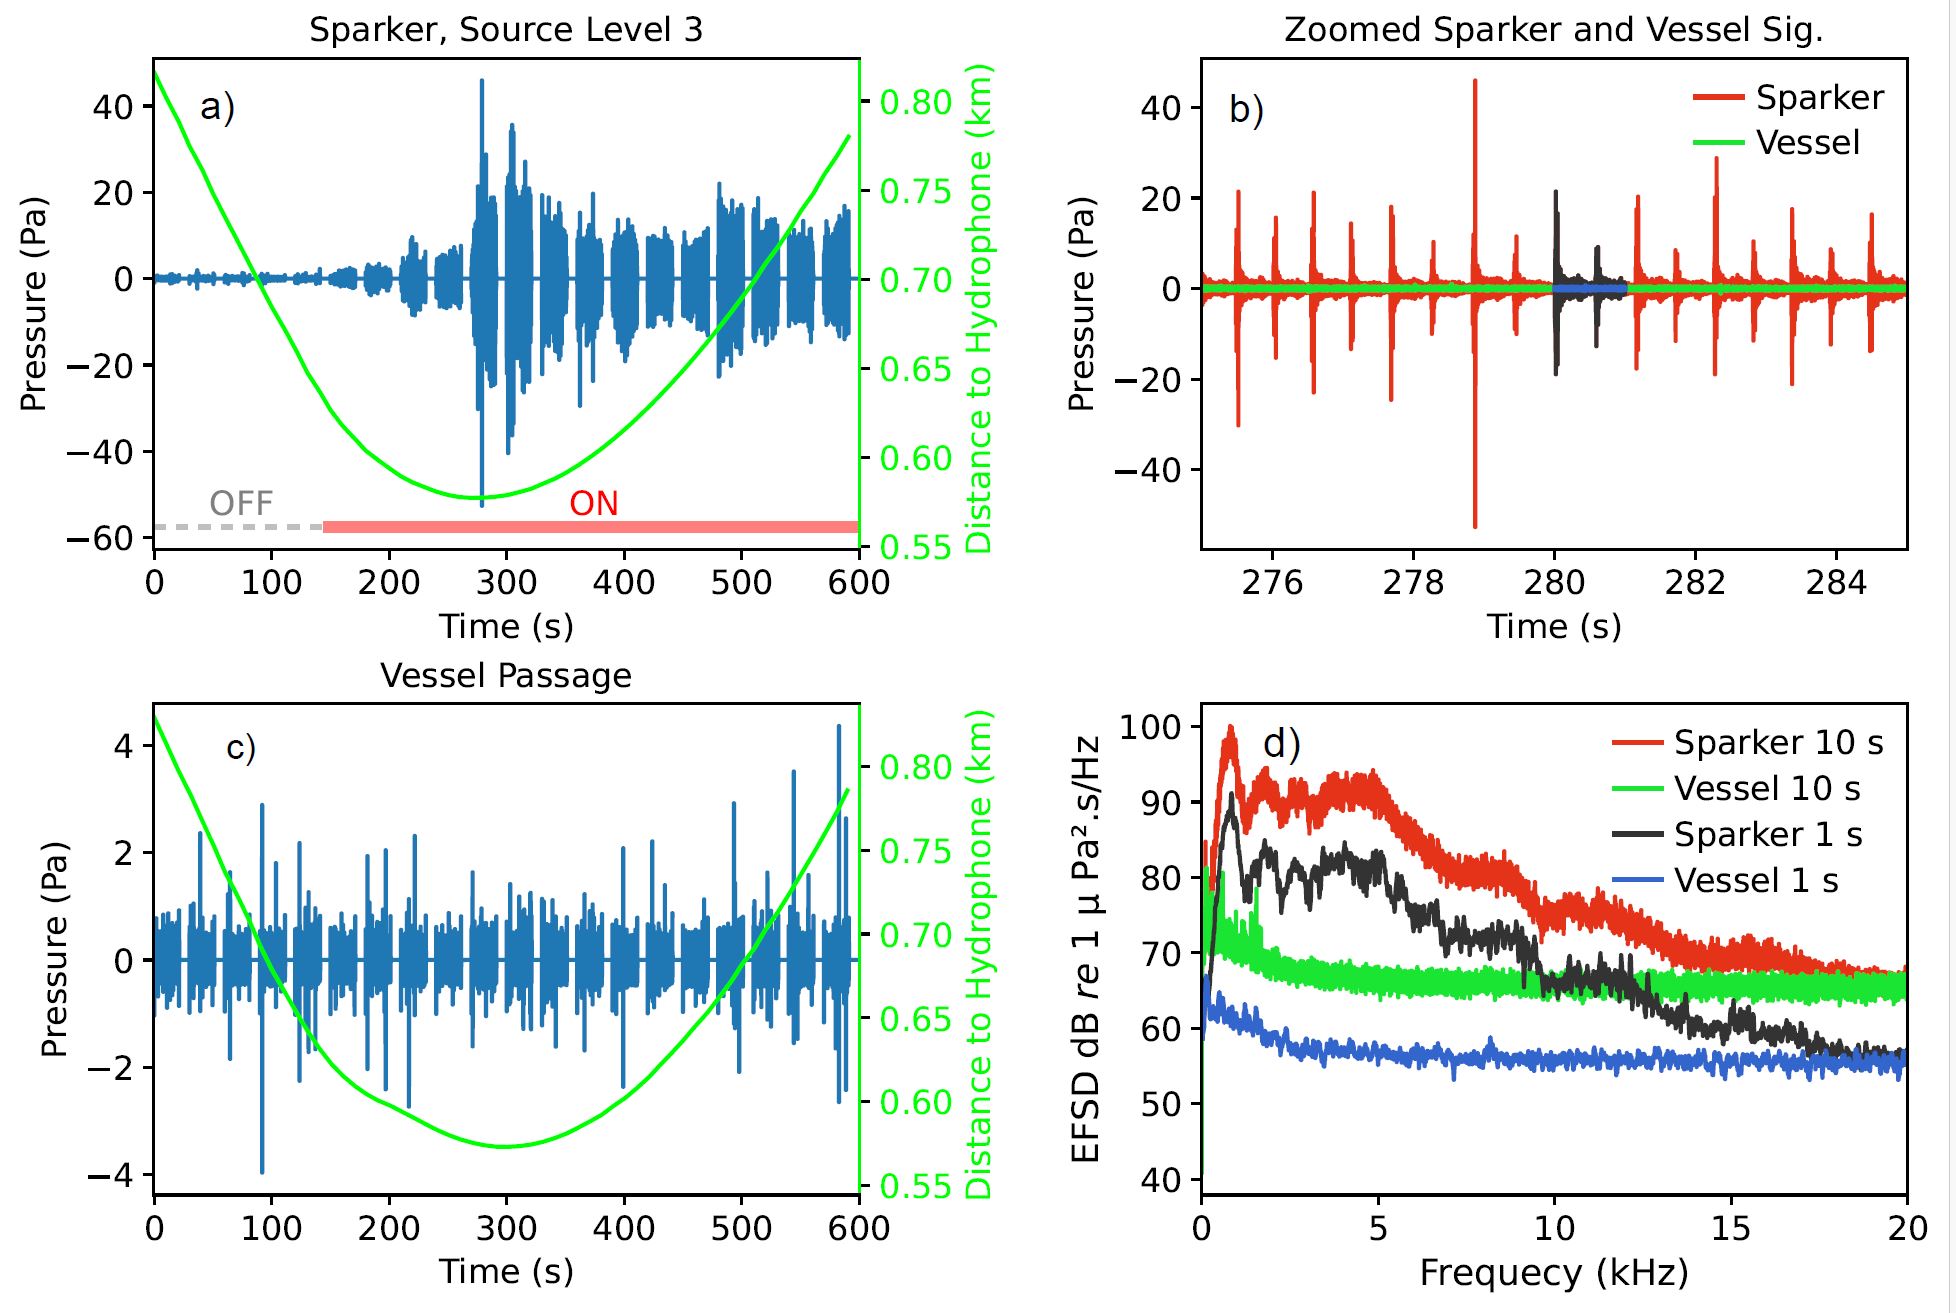
Figure 7. Overview of the recorded sound signals from the outer hydrophone at level 3 (loudest signal). a) and b) show the sound pressure as a function of distance and time for the sparker signal (a) and vessel passage (b). c) is zoomed in for a period of 10 sec, showing the single sparks in more detail. The red/black and green/blue in c) corresponds to the red/black and green/blue in d) showing the Energy Flux Spectral Density (EFSD) over 10 sec (red and green for sparker and vessel, respectively) and for 1 sec (black and blue for sparker and vessel, respectively). The figure show recordings from the outer hydrophone position (see location in Figure 1) recorded by the Naxys hydrophone.