Gå til hovedinnhold
Havforskningsinstituttet
HI
English
<- Tilbake
Søk
Søk
Søk
View page in English
Figur
Fra rapporten:
Antarctic krill and ecosystem monitoring survey off the South Orkney Islands in 2024
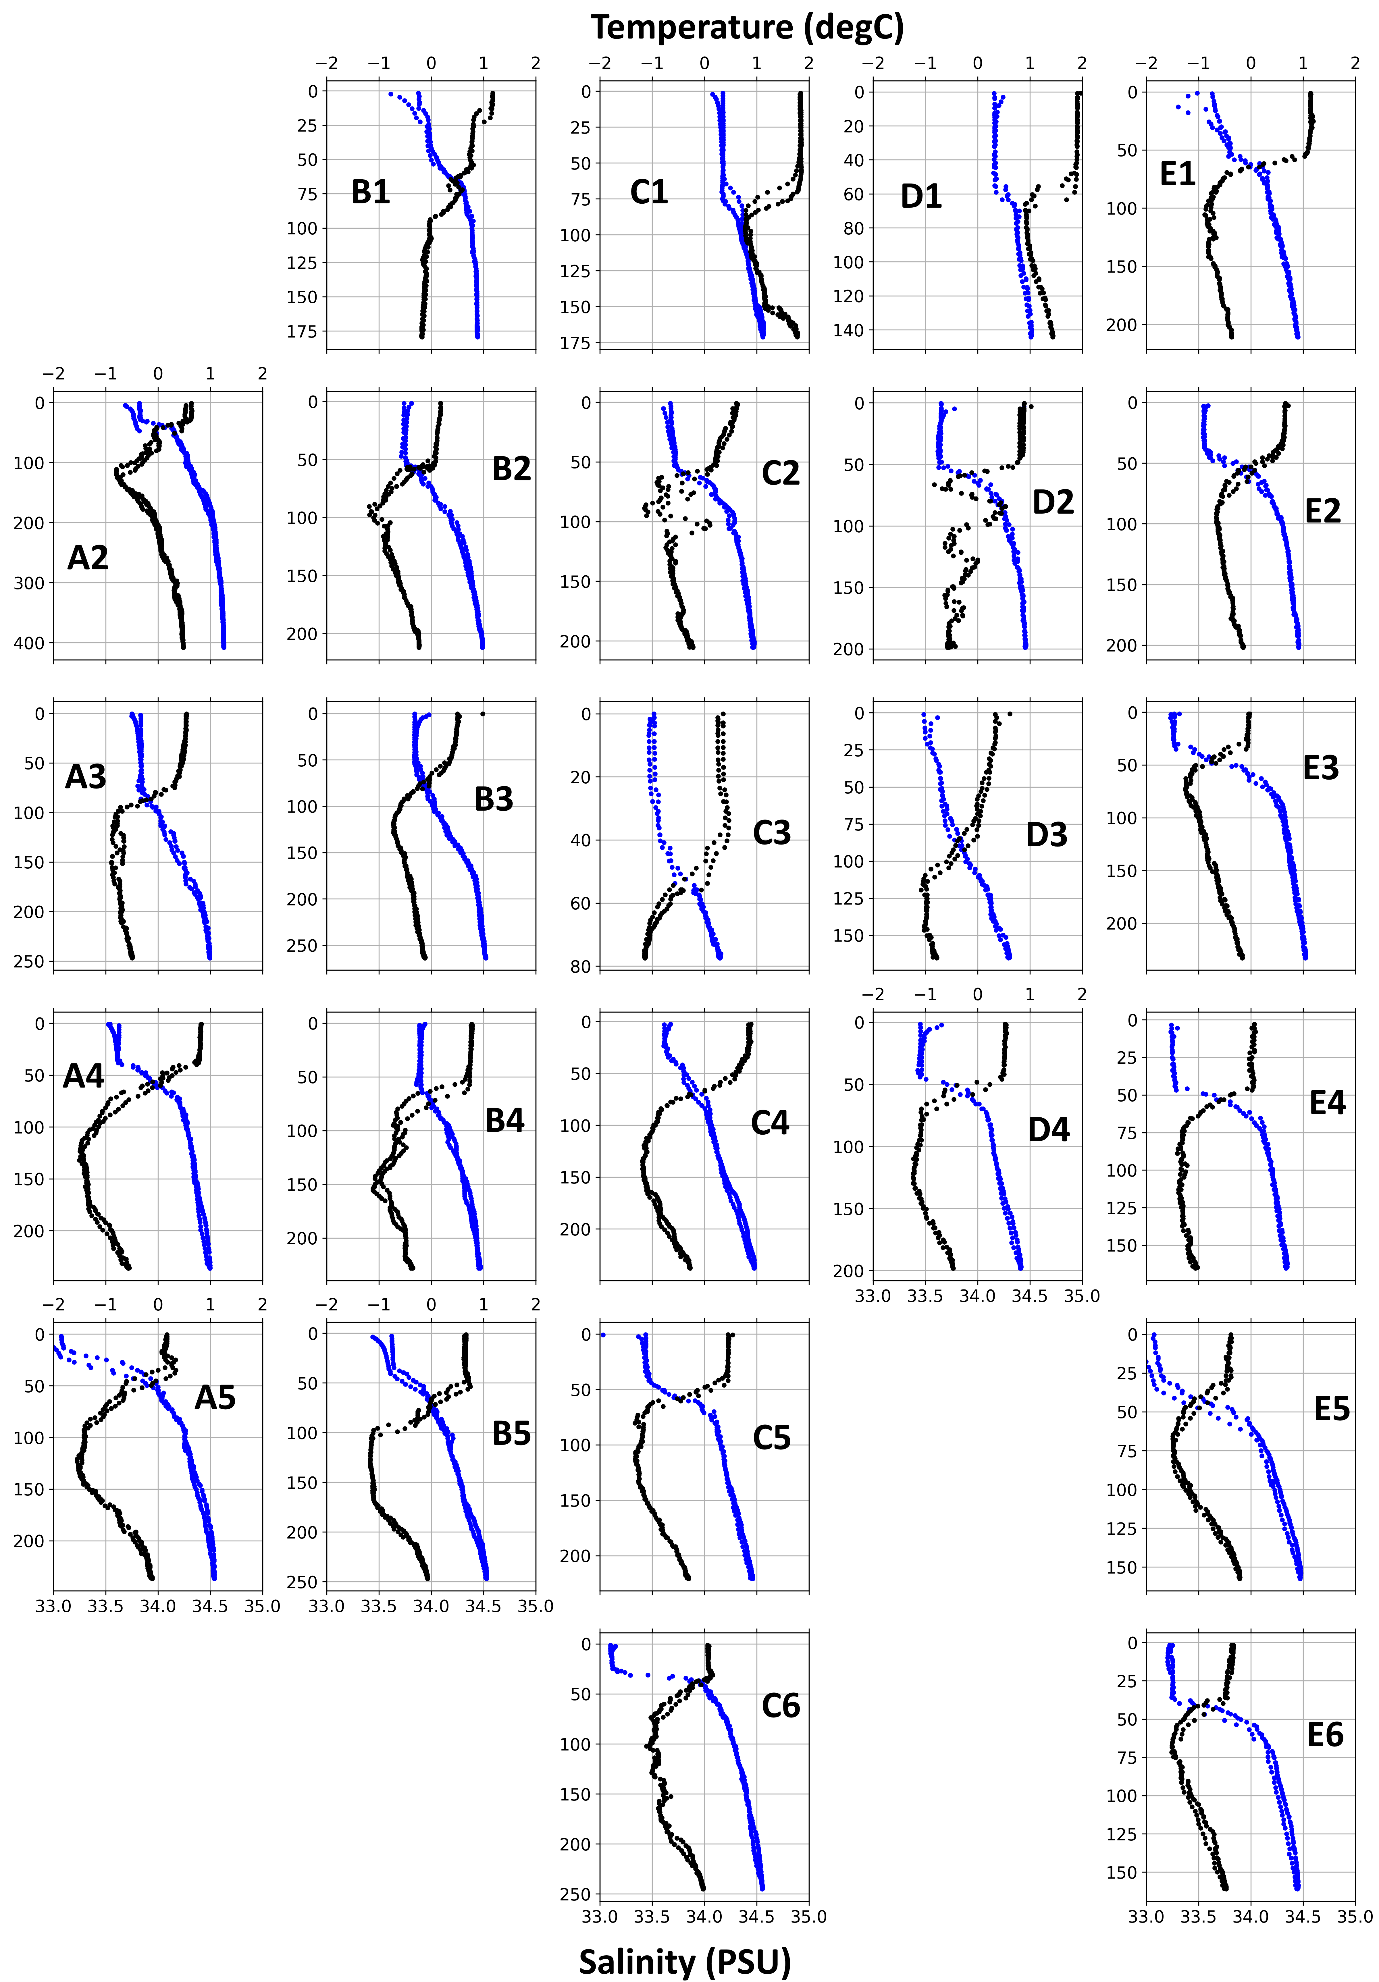
Figure 15. Hydrographical profiles from the ctd-casts with temperature in black and salinity in blue.