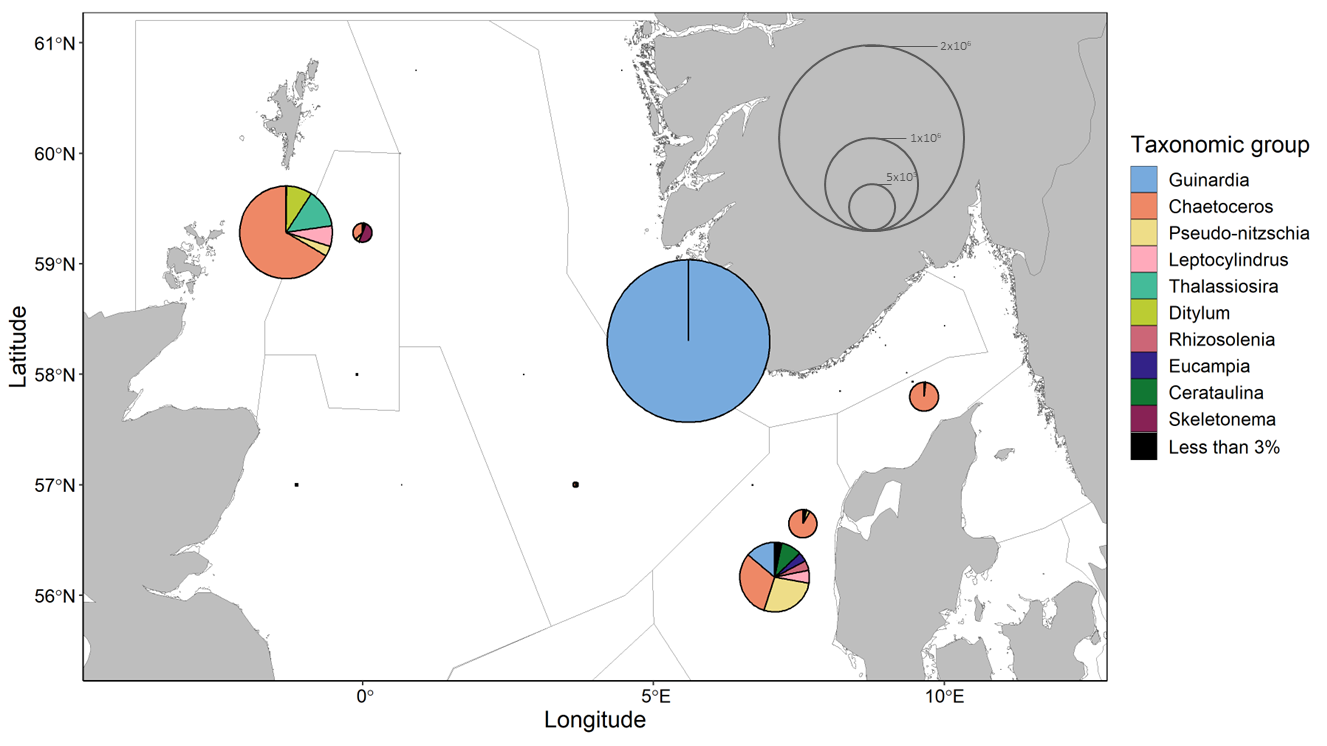
Figure 13 . D iatom community composition and abundance at sampled stations. Pie chart radii scale to average cell concentrations. Divisions within pie charts show the contributions from different diatom genera in cells per liter. Groups accounting for less than 3% of a community at a given station are summed.