Gå til hovedinnhold
Havforskningsinstituttet
HI
English
<- Tilbake
Søk
Søk
Søk
View page in English
Figur
Fra rapporten:
North Sea Ecosystem
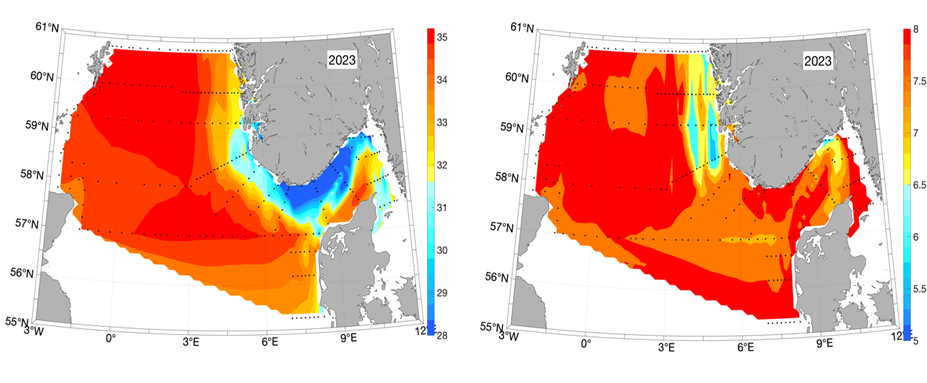
Figure 6. Salinity (left panel) and temperature (right panel, in o C) at 10m depth based on the hydrographic stations (marked with black dots) taken between 16/4 and 11/5 2023.