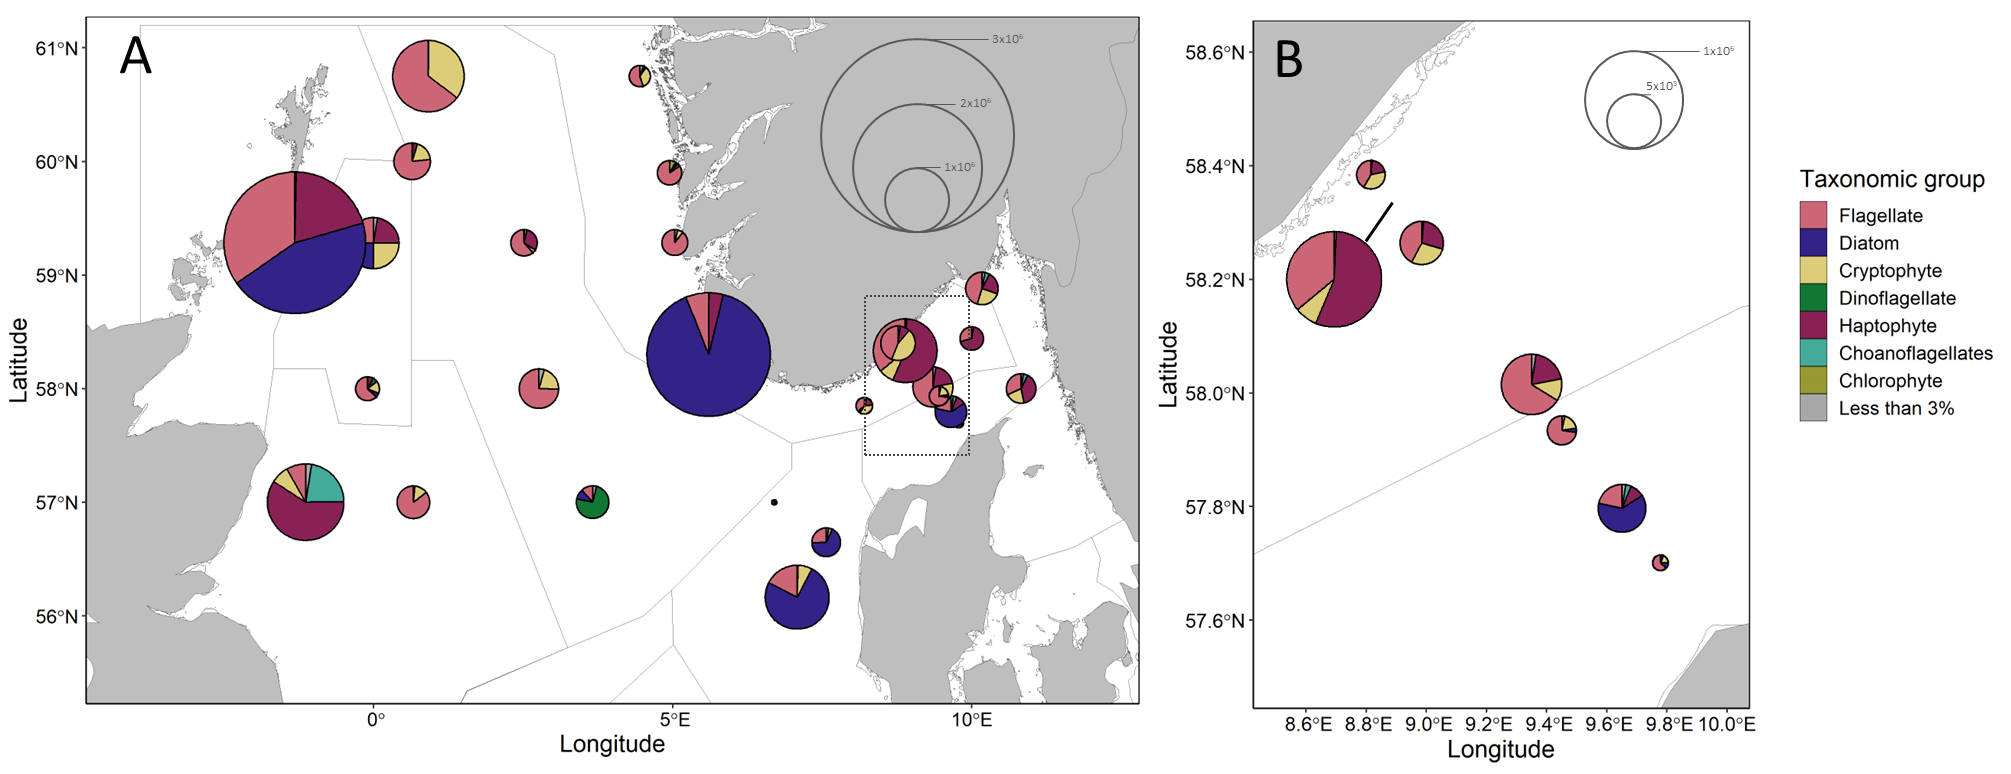
Figure 12. Microplankton community composition and abundance. A) All sampled stations, B) Inset from map A showing Torungen-Hirtshals. Divisions within pie charts show the contributions from broad taxonomic groups in cells per liter. Pie chart radii scale to average cell concentrations. Groups accounting for less than 3% of a community at a given station are summed.