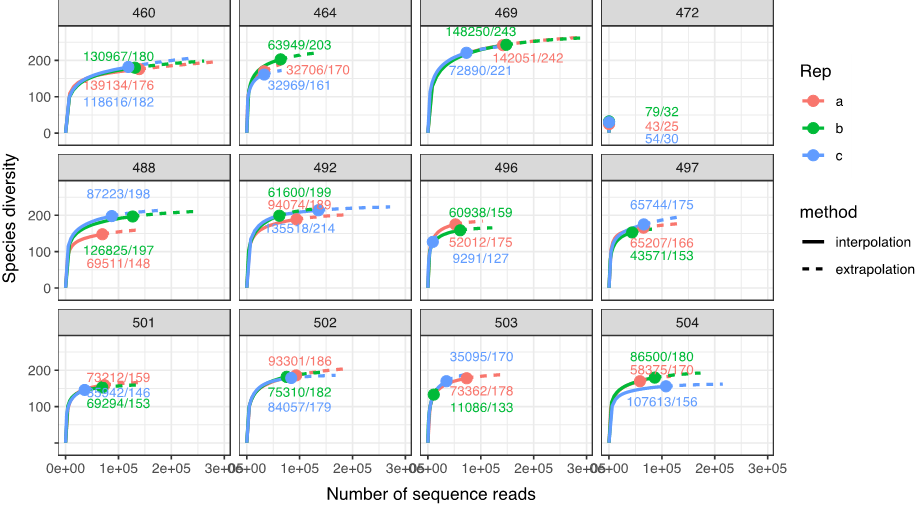
Figure 25. Examples of 12 rarefaction curves of WP2 samples, with numbers on plot indicating total number of reads/# species recovered per replicate. One sample among the WP2 samples (st. 472), and 14 samples among the GULF VII samples (not shown) failed to produce sufficient reads across all 3 replicates.