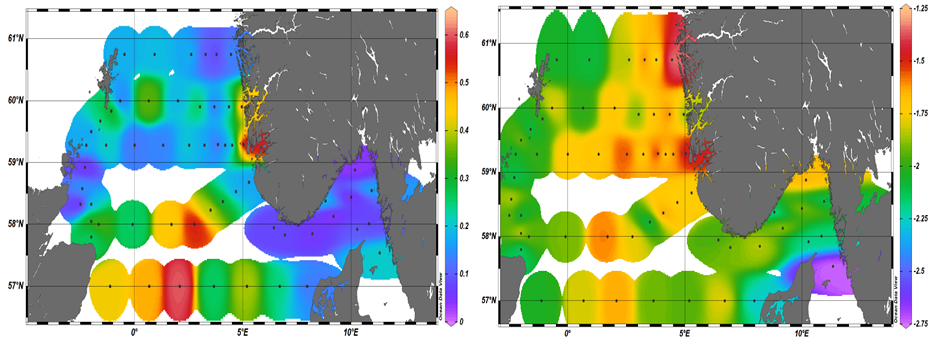
Figure 15. Left panel) : Areal distribution of Total zooplankton biomass during the North Sea Ecosystem Cruise 2023002006. Right panel) areal distribution of the slopes derived from the relationship between the number of organisms in each size class and their body volume. Warmer colors indicate a less steep slope and thus a higher contribution of larger organisms to the zooplankton community, while colder colors indicate a larger proportion of smaller organisms.