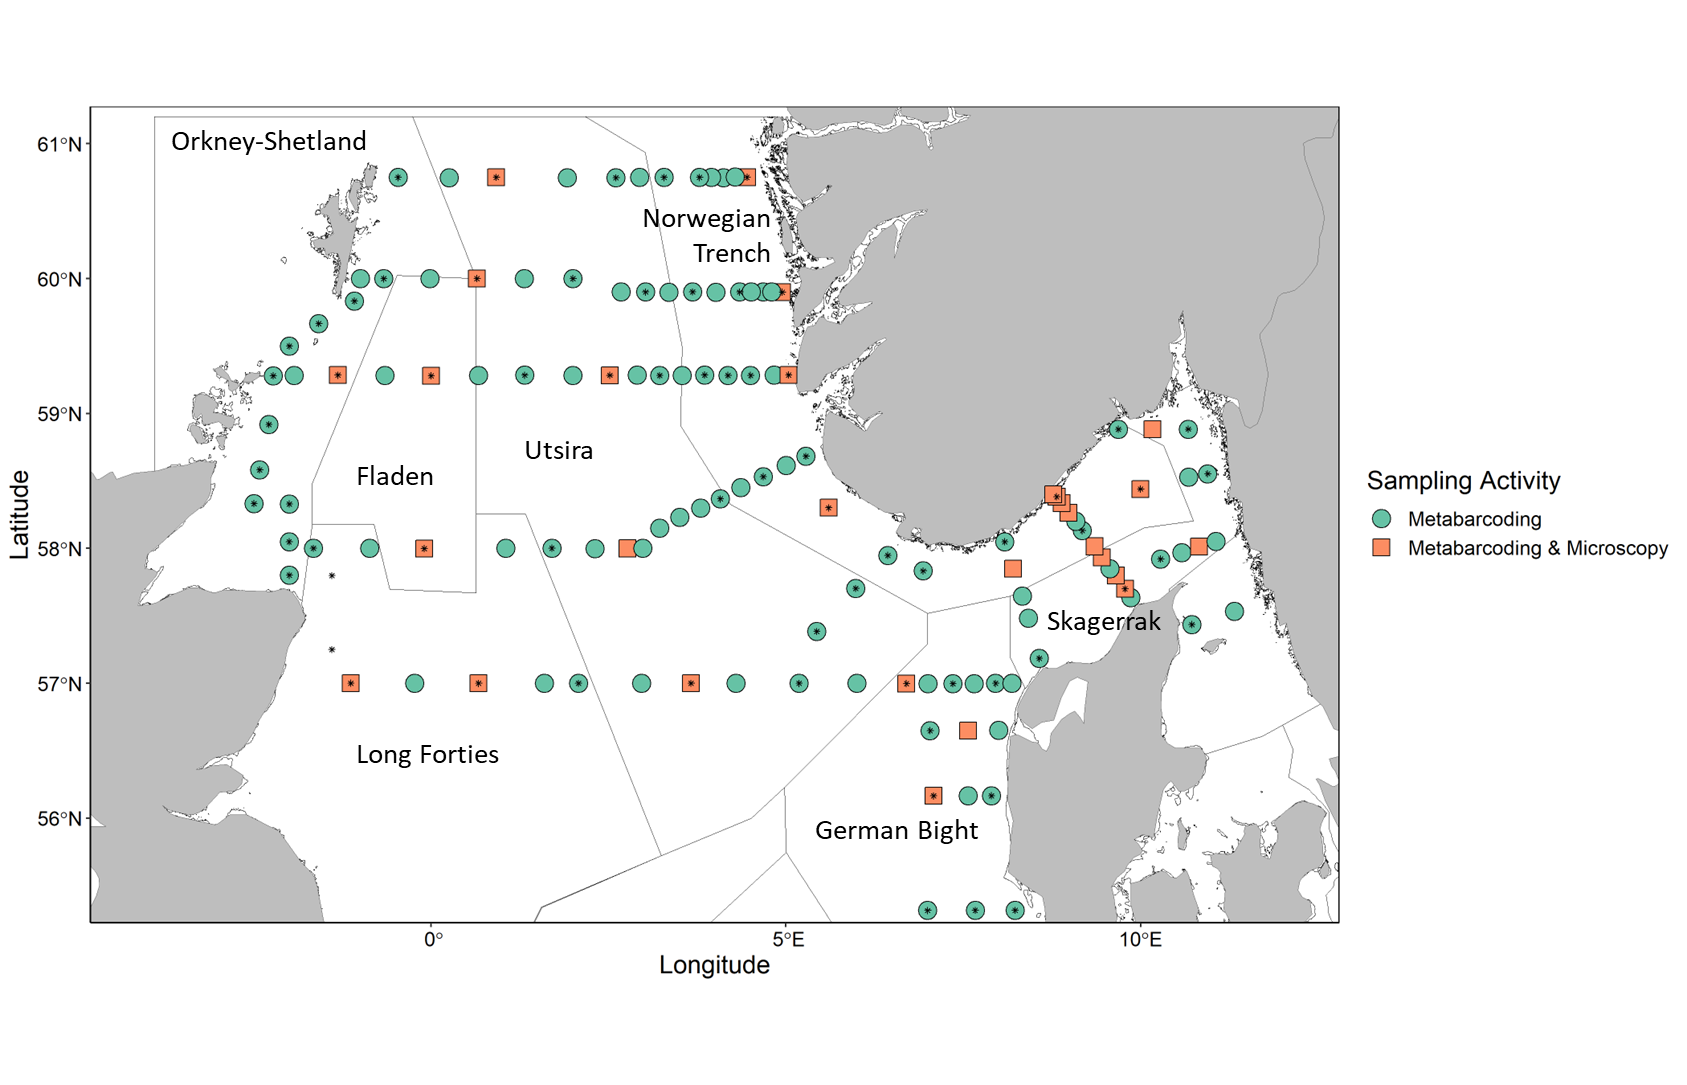
Figure 2. Map showing stations where phytoplankton samples were collected and analyzed. Shapes indicate sampling activities at a given station: circle- metabarcoding sample collection, square- microscopy sample analysis and metabarcoding sample collection, star: algae net sample collection. Outlined and labeled areas indicate WGINOSE sub-regions.