Gå til hovedinnhold
Havforskningsinstituttet
HI
English
<- Tilbake
Søk
Søk
Søk
View page in English
Figur
Fra rapporten:
North Sea Ecosystem
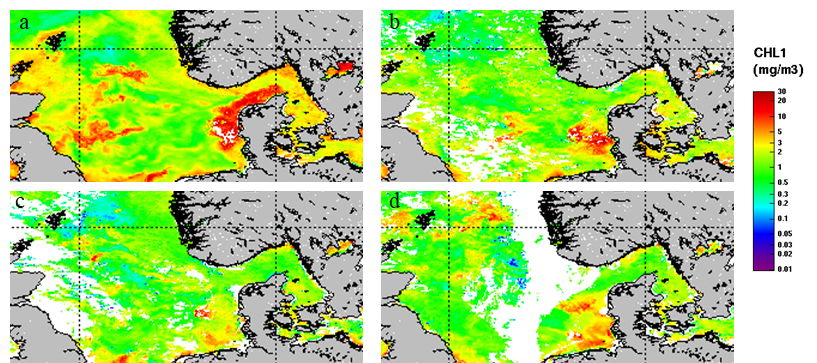
Figure 9. 8 days mean surface chlorophyll-a concentrations over the survey period. a) 15-22.04; b) 23-30.04; c) 01-08.05; d) 09- 16.05. MODIS satellite.