Gå til hovedinnhold
Havforskningsinstituttet
HI
English
<- Tilbake
Søk
Søk
Søk
View page in English
Figur
Fra rapporten:
North Sea Ecosystem
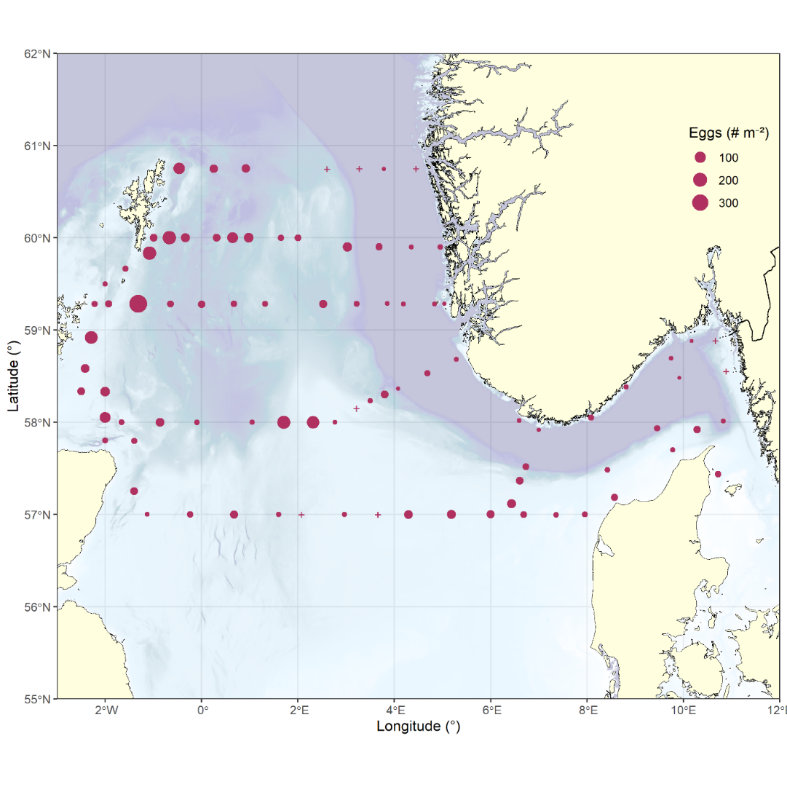
Figure 29. Distribution of fish eggs during the survey, raised to numbers per square meter (# m -2 ).