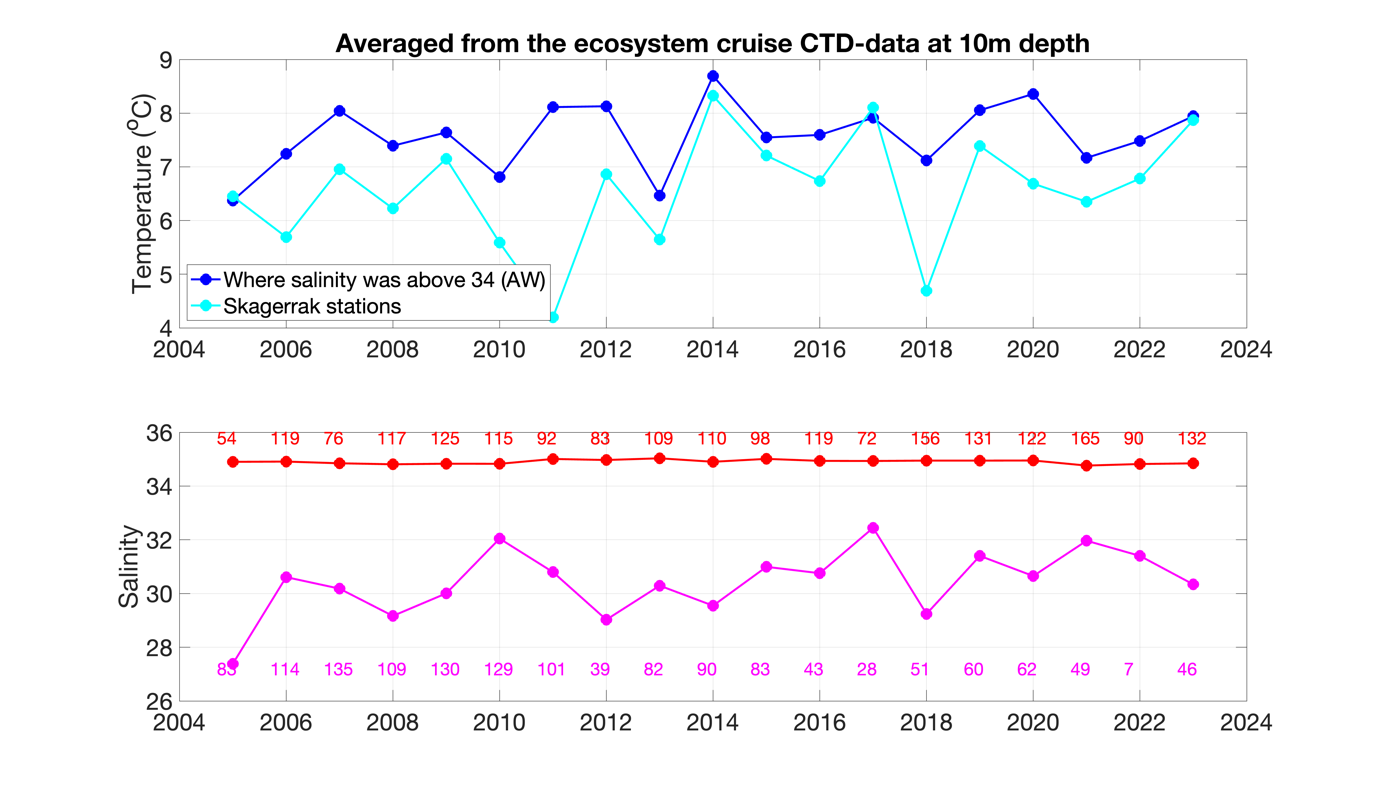
Figure 7. Time series of temperature (upper panel) and salinity (lower) at 10m depth as a spatial average over all ecosystem cruise stations for each year from 2005 to 2023. The stations have been separated in two categories: Areas heavily influenced by Atlantic water masses with salinity above 34 (blue and red) and Skagerrak stations (cyan and purple). Since the station coverage each year varies a lot, the number of valid data points is written as numbers in the lower panel.