Gå til hovedinnhold
Havforskningsinstituttet
HI
English
<- Tilbake
Søk
Søk
Søk
View page in English
Figur
Fra rapporten:
North Sea Ecosystem
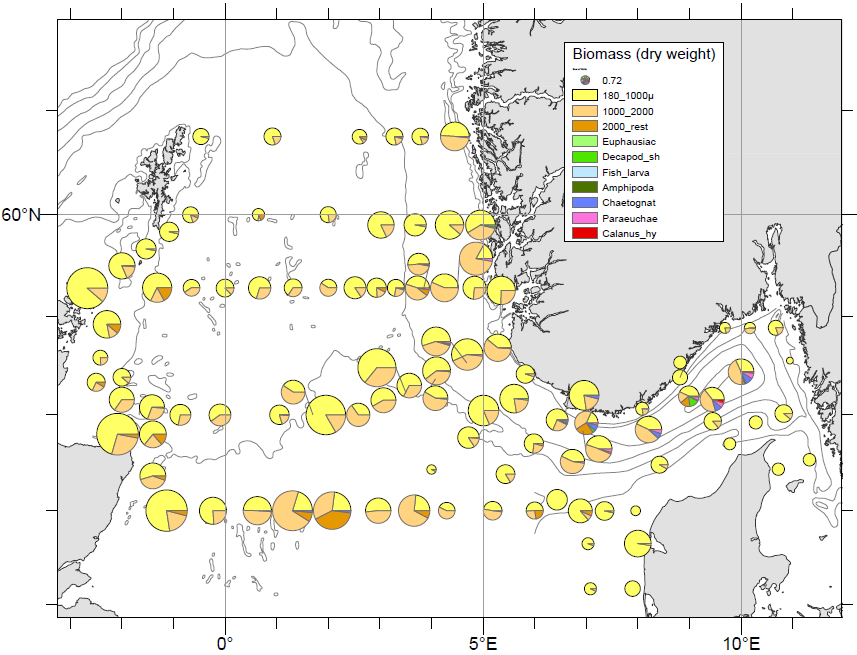
Figure 18 . Relative proportions of zooplankton size fractions in WP2 net tows (180 µm, bottom-surface). Pie chart radii indicating total biomass concentrations.