Stock Name: Northeast Arctic haddock (ICES areas 1 and 2)
Advice on fishing opportunities
The Joint Russian-Norwegian working group on Arctic Fisheries (JRN-AFWG) advises that when the Joint Norwegian–Russian Fisheries Commission management plan is applied, catches in 2025 should be no more than 106 912 tonnes.
Stock development over time
Fishing pressure on the stock is below Fpa and Flim and above Fmsy, and the spawning stock biomass is above Bpa and Blim.
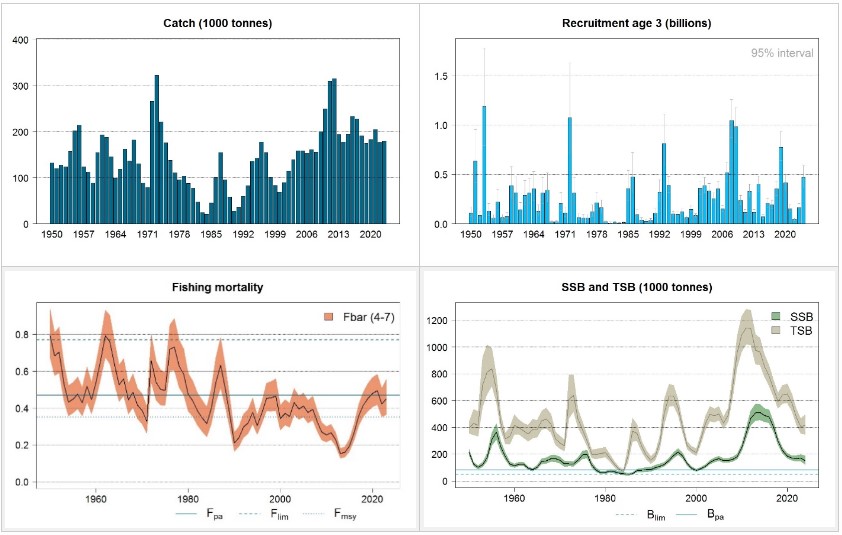
The decline in catches and spawning stock is expected to continue until the 2021 year-class is fully recruited to the fishery and spawning stock after age 5 (in 2026).
Catch scenarios
| Variable | Value | Notes |
|---|---|---|
| Fages 4–7 (202 4 ) | 0.49 | TAC constraint |
| SSB (2025) | 128 267 | |
| Rage 3 (2024) | 469 037 | SAM estimates |
| Rage 3 (2025) | 352 595 | RCT3 estimates |
| Rage 3 (2026) | 340 315 | RCT3 estimates |
| Total catch (2024) | 141 000 | TAC set by 53th JRNFC |
| Basis | Total catch (2025) | F ages 4−7 (2025) | SSB (2026) | % SSB change* | % TAC change** | % Advice change*** |
|---|---|---|---|---|---|---|
| Advice basis | ||||||
| Management plan | 106 912 | 0.35 | 148 477 | 16 | -24 | -16 |
| Other scenarios | ||||||
| MSY approach: FMSY | 106 912 | 0.35 | 148 477 | 16 | -24 | -16 |
| F = 0 | 0 | 0.00 | 202 674 | 58 | -100 | -100 |
| F = F2024 | 142 841 | 0.49 | 131 783 | 3 | 1 | 12 |
| Fpa | 137 261 | 0.47 | 134 320 | 5 | -3 | 8 |
| Flim | 202 346 | 0.77 | 106 114 | -17 | 44 | 59 |
* SSB 2026 relative to SSB 2025.
** Catch in 2025 relative to TAC in 2024 (141 000 t)
*** Catch value for 2025 relative to advice value for 2024 (127 550 t)
The TAC advice for 2025 is 16% lower than the advice and 24% lower than the TAC for 2024 due to a declining stock trend in recent years.
Basis of the advice
| Advice basis | Joint Norwegian-Russian Fisheries Commission management plan. |
|---|---|
| Management plan | The current harvest control rule (HCR) for haddock is as follows (see details in Protocol of the 46 th Session of the Joint Norwegian–Russian Fisheries Commission [JNRFC, 2016]):
|
Quality of the assessment
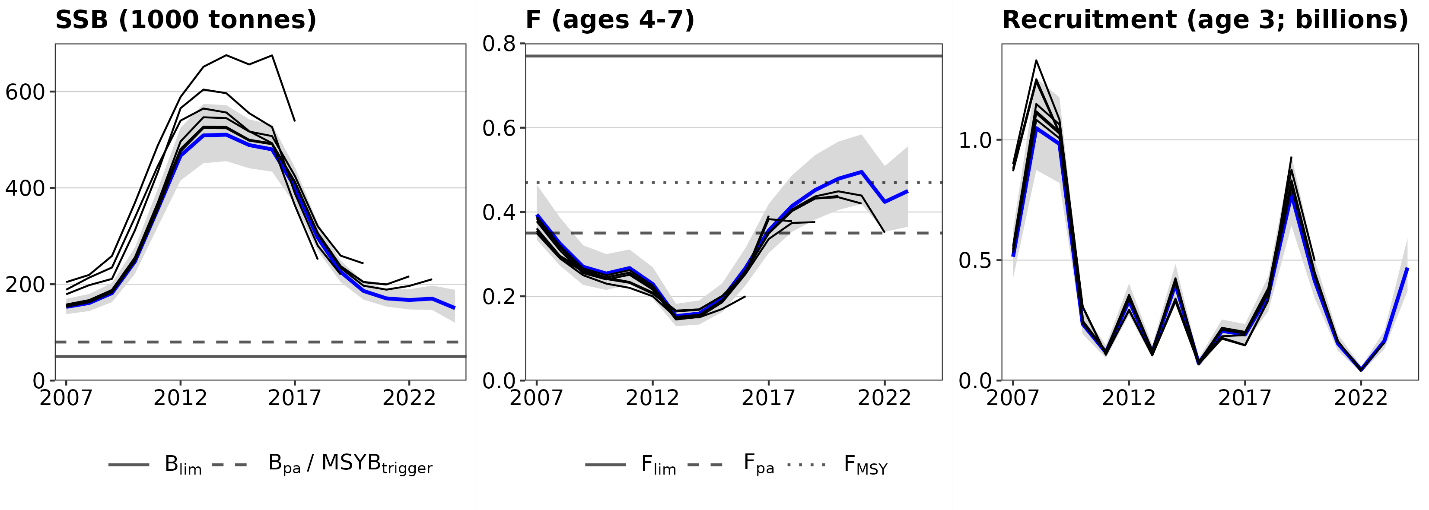
There was a downward revision of the SSB in this year’s assessment.
Issues relevant for the advice
Due to the temporary suspension of Russian scientists from ICES this assessment was conducted by a Joint Russian-Norwegian working group on Arctic Fisheries (JRN-AFWG) consisting of scientists from VNIRO (Russia), and IMR (Norway) (Howell et al., 2024).
This advice has been conducted outside ICES and should not be considered as ICES advice. However, this assessment and advice has been produced following the methodology agreed at the ICES benchmark in 2020 (ICES, 2020).
The 2015-2017 year-classes that have dominated the catches are now being fished out, and the 2018-2020 year-classes are weak, so the stock is declining. Early indications are that the incoming year-classes are average or above average. For the stock to increase, it is important that these year-classes are not fished out before they mature and reach their growth potential.
Reference points
| Framework | Reference point | Value | Technical basis | Source |
|---|---|---|---|---|
| MSY approach | MSY Btrigger | 80 000 tonnes | Bpa | ICES (2020) |
| FMSY | 0.35 | Stochastic long-term simulations | ICES (2020) | |
| Precautionary approach | Blim | 50 000 tonnes | Bloss | ICES (2020) |
| Bpa | 80 000 tonnes | Blim × exp (1.645 × σ ), where σ = 0.3 | ICES (2020) | |
| Flim | 0.77 | Determined from replacement line leading from SSB = 0 to the geometric mean recruitment at SSB = Blim | ICES (2020) | |
| Fpa | 0.47 | Flim × exp (−1.645 × σ ), where σ = 0.3 | ICES (2020) | |
| Management plan | SSBMGT | 80 000 tonnes | Bpa | ICES (2020) |
| FMGT | 0.35 | FMSY | ICES (2020) |
Basis of the assessment
| ICES stock data category | 1 |
|---|---|
| Assessment type | Age-based analytical assessment (SAM) that uses catches in the model. |
| Input data | Commercial landings (international landings, ages, and length frequencies from catch sampling); four survey indices (RU-BTr-Q4 (Btr), BS-NoRU-Q1(Aco), BS-NoRu-Q1 (BTr), and Eco-NoRu-Q3 (Btr)); annual maturity and stock weight-at-age data from surveys; from 1984, the natural mortalities are derived from the consumption of haddock (ages 3–6) by cod. |
| Discards and bycatch | Discarding is considered negligible in recent years. |
| Indicators | None. |
| Other information | Last benchmarked in February 2020 (ICES, 2020). |
| Working group | Joint Russian-Norwegian working group on Arctic Fisheries (JRN-AFWG). |
History of the advice, catch, and management
| Year | ICES advice | Catch corresponding to advice | Agreed TAC | Official catches | Unreported landings (included in ICES catches) | ICES catches |
|---|---|---|---|---|---|---|
| 1987 | No increase in F; TAC | 160000 | 250000 | 154916 | 154916 | |
| 1988 | No increase in F | < 240000 | 240000 | 95255 | 95255 | |
| 1989 | Large reduction in F | 69000 | 83000 | 58518 | 58518 | |
| 1990 | No directed fishery | - | 25000 | 27182 | 27182 | |
| 1991 | No directed fishery | - | 28000 | 36216 | 36216 | |
| 1992 | Within safe biological limits | 35000 | 63000 | 59922 | 59922 | |
| 1993 | No long-term gains in increasing F | 56000 | 72000 | 82379 | 82379 | |
| 1994 | No long-term gains in F > Fmed | 97000* | 120000 | 135186 | 135186 | |
| 1995 | No long-term gains in F > Fmed | 122000* | 130000 | 142448 | 142448 | |
| 1996 | No long-term gains in F > Fmed | 169000* | 170000 | 178128 | 178128 | |
| 1997 | Well below Fmed | < 242000 | 210000 | 154359 | 154359 | |
| 1998 | Below Fmed | < 120000 | 130000 | 100630 | 100630 | |
| 1999 | Reduce F below Fpa | < 74000 | 78000 | 83195 | 83195 | |
| 2000 | Reduce F below Fpa | < 37000 | 62000 | 68944 | 68944 | |
| 2001 | Reduce F below Fpa | < 66000 | 85000 | 89640 | 89640 | |
| 2002 | Reduce F below Fpa | < 64000 | 85000 | 96062 | 18736 | 114798 |
| 2003 | Reduce F below Fpa | < 101000 | 101000 | 105700 | 33226 | 138926 |
| 2004 | Reduce F below Fpa | < 120000 | 130000 | 124502 | 33777 | 158279 |
| 2005 | Reduce F below Fpa | < 106000 | 117000 | 118015 | 40283 | 158298 |
| 2006 | Reduce F below Fpa | < 112000 | 120000 | 131706 | 21451 | 153157 |
| 2007 | Limit catches | < 130000 | 150000 | 146972 | 14553 | 161525 |
| 2008 | Limit catches to 2001–2004 average | < 130000 | 155000 | 149776 | 5828 | 155604 |
| 2009 | Apply management plan | < 194000 | 194000 | 200061 | 0 | 200061 |
| 2010 | Apply management plan | < 243000 | 243000 | 249200 | 0 | 249200 |
| 2011 | Apply management plan | < 303000 | 303000 | 309785 | 0 | 309785 |
| 2012 | Apply management plan | < 318000 | 318000 | 315627 | 0 | 315627 |
| 2013 | Apply management plan | < 238000 | 200000 | 193744 | 0 | 193744 |
| 2014 | Apply management plan | < 150000 | 178500 | 177522 | 0 | 177522 |
| 2015 | Apply management plan | < 165000 | 223000 | 194756 | 0 | 194756 |
| 2016 | Apply management plan | < 244000^ | 244000 | 233416 | 0 | 233416 |
| 2017 | Apply management plan | ≤ 233000 | 233000 | 227588 | 0 | 227588 |
| 2018 | Apply management plan | ≤ 202305 | 202305 | 191276 | 0 | 191276 |
| 2019 | Apply management plan | ≤ 152000 | 172000 | 175402 | 0 | 175402 |
| 2020 | Apply management plan | ≤ 215000 | 215000 | 182468 | 0 | 182468 |
| 2021 | Apply management plan | ≤ 232537 | 232537 | 204843 | 0 | 204743^^ |
| 2022 | Apply management plan | ≤ 178532 | 178532 | 176906 | 0 | 176906^^ |
| 2023 | Apply management plan | ≤ 170067^^ | 170067 | 178899 | 0 | 178899^^ |
| 2024 | Apply management plan | ≤ 127550^^ | 141000 | |||
| 2025 | Apply management plan | ≤ 106912^^ |
* Predicted landings at Fmed.
^ This advice was updated on 7 July 2015 in response to a special request (ICES, 2015) after a mid-year change in TAC in 2015 (from 178500 tonnes to 223000 tonnes).
^^ In 2022-2024 assessment and advice was carried out by the Joint Russian-Norwegian working group on Arctic Fisheries (JRN-AFWG) which compiled catches for 2021-2023 and gave advice for 2023-2025.
History of catch and landings
| Year | Faroe Islands | France | Fed. Rep. Germany. | Greenland | Norway^ | Russia** | Spain | United Kingdom | Others | Unreported catches*** | Total |
|---|---|---|---|---|---|---|---|---|---|---|---|
| 1960 | 172 | - | 5597 | 46263 | 57025 | 45469 | 125 | - | 154651 | ||
| 1961 | 285 | 220 | 6304 | 60862 | 85345 | 39650 | 558 | - | 193224 | ||
| 1962 | 83 | 409 | 2895 | 54567 | 91910 | 37486 | 58 | - | 187408 | ||
| 1963 | 17 | 363 | 2554 | 59955 | 63526 | 19809 | - | - | 146224 | ||
| 1964 | - | 208 | 1482 | 38695 | 43870 | 14653 | 250 | - | 99158 | ||
| 1965 | - | 226 | 1568 | 60447 | 41750 | 14345 | 242 | - | 118578 | ||
| 1966 | - | 1072 | 2098 | 82090 | 48710 | 27723 | 85 | - | 161778 | ||
| 1967 | - | 1208 | 1705 | 51954 | 57346 | 24158 | 26 | - | 136397 | ||
| 1968 | - | - | 1867 | 64076 | 75654 | 40129 | 0 | - | 181726 | ||
| 1969 | 2 | - | 1490 | 67549 | 24211 | 37234 | 334 | - | 130820 | ||
| 1970 | 541 | - | 2119 | 37716 | 26802 | 20423 | 656 | - | 88257 | ||
| 1971 | 81 | - | 896 | 45715 | 15778 | 16373 | 62 | - | 78905 | ||
| 1972 | 137 | - | 1433 | 46700 | 196224 | 17166 | 4493 | - | 266153 | ||
| 1973 | 1212 | 3214 | 9534 | 86767 | 186534 | 32408 | 2557 | - | 322226 | ||
| 1974 | 925 | 3601 | 23409 | 66164 | 78548 | 37663 | 10847 | - | 221157 | ||
| 1975 | 299 | 5191 | 15930 | 55966 | 65015 | 28677 | 4680 | - | 175758 | ||
| 1976 | 536 | 4459 | 16660 | 49492 | 42485 | 16940 | 6692 | - | 137264 | ||
| 1977 | 213 | 1510 | 4798 | 40118 | 52210 | 10878 | 431 | - | 110158 | ||
| 1978 | 466 | 1411 | 1521 | 39955 | 45895 | 5766 | 408 | - | 95422 | ||
| 1979 | 343 | 1198 | 1948 | 66849 | 26365 | 6454 | 466 | - | 103623 | ||
| 1980 | 497 | 226 | 1365 | 66501 | 20706 | 2948 | 261 | - | 92504 | ||
| 1981 | 381 | 414 | 2402 | 63435 | 13400 | 1682 | 22 | - | 81736 | ||
| 1982 | 496 | 53 | 1258 | 43702 | 2900 | - | 827 | 0 | - | 49236 | |
| 1983 | 428 | - | 729 | 22364 | 680 | 139 | 259 | 1 | - | 24600 | |
| 1984 | 297 | 15 | 400 | 18813 | 1103 | 37 | 276 | 4 | - | 20945 | |
| 1985 | 424 | 21 | 395 | 21272 | 22690 | 77 | 153 | 20 | - | 45052 | |
| 1986 | 893 | 12 | 1079 | 52313 | 45738 | 22 | 431 | 75 | - | 100563 | |
| 1987 | 464 | 7 | 3105 | 72419 | 78211 | 59 | 563 | 88 | - | 154916 | |
| 1988 | 1113 | 116 | 1323 | 60823 | 31293 | 72 | 435 | 80 | - | 95255 | |
| 1989 | 1217 | - | 171 | 36451 | 20062 | 1 | 590 | 26 | - | 58518 | |
| 1990 | 705 | - | 167 | 20621 | 5190 | - | 494 | 5 | - | 27182 | |
| 1991 | 1117 | - | 213 | 22178 | 12177 | - | 514 | 17 | - | 36216 | |
| 1992 | 1093 | 151 | 387 | 1719 | 36238 | 19699 | 38 | 596 | 1 | - | 59922 |
| 1993 | 546 | 1215 | 1165 | 880 | 40978 | 35071 | 76 | 1802 | 646 | - | 82379 |
| 1994 | 2761 | 678 | 2412 | 770 | 71171 | 51822 | 22 | 4673 | 877 | - | 135186 |
| 1995 | 2833 | 598 | 2675 | 1097 | 76886 | 54516 | 14 | 3111 | 718 | - | 142448 |
| 1996 | 3743 | 6 | 942 | 1510 | 94527 | 74239 | 669 | 2275 | 217 | - | 178128 |
| 1997 | 3327 | 540 | 972 | 1877 | 103407 | 41228 | 364 | 2340 | 304 | - | 154359 |
| 1998 | 1903 | 241 | 385 | 854 | 75108 | 20559 | 257 | 1229 | 94 | - | 100630 |
| 1999 | 1913 | 64 | 641 | 437 | 48182 | 30520 | 652 | 694 | 92 | - | 83195 |
| 2000 | 631 | 178 | 880 | 432 | 42009 | 22738 | 502 | 747 | 827 | - | 68944 |
| 2001 | 1210 | 324 | 554 | 553 | 49067 | 34307 | 1497 | 1068 | 1060 | - | 89640 |
| 2002 | 1564 | 297 | 627 | 858 | 52247 | 37157 | 1505 | 1125 | 682 | 18736 | 114798 |
| 2003 | 1959 | 382 | 918 | 1363 | 56485 | 41142 | 1330 | 1018 | 1103 | 33226 | 138926 |
| 2004 | 2484 | 103 | 823 | 1680 | 62192 | 54347 | 54 | 1250 | 1569 | 33777 | 158279 |
| 2005 | 2138 | 333 | 996 | 15 | 60850 | 50012 | 963 | 1899 | 1262 | 40283 | 158751 |
| 2006 | 2390 | 883 | 989 | 1830 | 69272 | 53313 | 703 | 1164 | 1162 | 21451 | 153157 |
| 2007 | 2307 | 277 | 1123 | 1464 | 71244 | 66569 | 125 | 1351 | 2511 | 14553 | 161525 |
| 2008 | 2687 | 311 | 535 | 1659 | 72779 | 68792 | 283 | 971 | 1759 | 5828 | 155604 |
| 2009 | 2820 | 529 | 1957 | 1410 | 104354 | 85514 | 317 | 1315 | 1845 | 0 | 200061 |
| 2010 | 3173 | 764 | 3539 | 1970 | 123384 | 111372 | 379 | 1758 | 2862 | 0 | 249200 |
| 2011 | 1759 | 268 | 1724 | 2110 | 158202 | 139912 | 502 | 1379 | 3929 | 0 | 309785 |
| 2012 | 2055 | 322 | 1111 | 3984 | 159602 | 143886 | 441 | 833 | 3393 | 0 | 315627 |
| 2013 | 1886 | 342 | 500 | 1795 | 99215 | 85668 | 439 | 639 | 3260 | 0 | 193744 |
| 2014 | 1470 | 198 | 340 | 1150 | 91306 | 78725 | 187 | 355 | 3791 | 0 | 177522 |
| 2015 | 2459 | 145 | 124 | 1047 | 95094 | 91864 | 246 | 450 | 3327 | 0 | 194756 |
| 2016 | 2460 | 340 | 170 | 1401 | 108718 | 115710 | 200 | 575 | 3838 | 0 | 233416 |
| 2017 | 2776 | 108 | 170 | 1810 | 113132 | 106714 | 228 | 372 | 2279 | 0 | 227588 |
| 2018 | 2333 | 183 | 385 | 1317 | 93839 | 90486 | 169 | 453 | 2173 | 0 | 191276 |
| 2019 | 1515 | 143 | 204 | 1208 | 93860 | 76125 | 280 | 456 | 1611 | 0 | 175402 |
| 2020 | 1392 | 96 | 282 | 910 | 88108 | 89030 | 45 | 320 | 2286 | 0 | 182468 |
| 2021^^ | 1722 | 105 | 365 | 1101 | 100673 | 98296 | 131 | 78 | 2272 | 0 | 204743 |
| 2022^^ | 1831 | 164 | 268 | 1101 | 89044 | 82364 | 99 | 138 | 1897 | 0 | 176906 |
| 2023*^^ | 1993 | 235 | 296 | 672 | 91325 | 81751 | 139 | 112 | 2376 | 0 | 178899 |
* Provisional figures.
** USSR prior to 1991.
*** Figures based on Norwegian/Russian illegal, unreported, and unregulated fisheries (IUU) estimates.
^ Landings of coastal haddock in Norwegian statistical areas 06 and 07 (south of Lofoten) are included from 1983.
^^ In 2022-2024 assessment and advice was carried out by the Joint Russian-Norwegian working group on Arctic Fisheries (JRN-AFWG) which compiled catches for 2021-2023 and gave advice for 2023-2025.
Summary of the assessment
| Year | Recruitment (thousands) | SSB (tonnes) | Total catch (tonnes) | F | ||||||
|---|---|---|---|---|---|---|---|---|---|---|
| Age 3 | Low | High | SSB | Low | High | Ages 4–7 | Low | High | ||
| 1950 | 110038 | 70318 | 172195 | 213098 | 190932 | 237837 | 132125 | 0.794 | 0.673 | 0.935 |
| 1951 | 633959 | 422176 | 951982 | 124868 | 110849 | 140660 | 120077 | 0.684 | 0.577 | 0.811 |
| 1952 | 83966 | 54059 | 130419 | 101012 | 88332 | 115513 | 127660 | 0.704 | 0.59 | 0.84 |
| 1953 | 1186876 | 792673 | 1777121 | 120410 | 104189 | 139155 | 123920 | 0.532 | 0.441 | 0.643 |
| 1954 | 131478 | 84861 | 203703 | 173385 | 147570 | 203715 | 156788 | 0.431 | 0.356 | 0.523 |
| 1955 | 59255 | 37752 | 93006 | 309421 | 264756 | 361621 | 202286 | 0.449 | 0.374 | 0.54 |
| 1956 | 222228 | 142942 | 345493 | 364154 | 310799 | 426668 | 213924 | 0.475 | 0.395 | 0.57 |
| 1957 | 61053 | 38964 | 95667 | 253086 | 217226 | 294865 | 123583 | 0.428 | 0.357 | 0.513 |
| 1958 | 74378 | 48008 | 115231 | 181370 | 157654 | 208654 | 112672 | 0.519 | 0.432 | 0.623 |
| 1959 | 385153 | 255704 | 580136 | 125441 | 109041 | 144308 | 88211 | 0.446 | 0.369 | 0.54 |
| 1960 | 314280 | 207100 | 476930 | 112870 | 99616 | 127888 | 154651 | 0.54 | 0.452 | 0.646 |
| 1961 | 142446 | 93949 | 215978 | 124441 | 110920 | 139609 | 193224 | 0.664 | 0.563 | 0.784 |
| 1962 | 290162 | 192872 | 436527 | 124618 | 110750 | 140222 | 187408 | 0.794 | 0.675 | 0.933 |
| 1963 | 312272 | 209555 | 465339 | 93938 | 82704 | 106698 | 146224 | 0.76 | 0.639 | 0.905 |
| 1964 | 352016 | 234914 | 527494 | 84244 | 74116 | 95757 | 99158 | 0.634 | 0.527 | 0.761 |
| 1965 | 125910 | 82095 | 193108 | 102938 | 90003 | 117731 | 118578 | 0.526 | 0.436 | 0.634 |
| 1966 | 309997 | 204532 | 469842 | 144858 | 126330 | 166104 | 161778 | 0.559 | 0.467 | 0.67 |
| 1967 | 339255 | 223412 | 515165 | 150777 | 130228 | 174568 | 136397 | 0.444 | 0.367 | 0.535 |
| 1968 | 18922 | 11732 | 30517 | 167119 | 144992 | 192622 | 181726 | 0.486 | 0.402 | 0.587 |
| 1969 | 20435 | 12628 | 33068 | 166772 | 143621 | 193655 | 130820 | 0.416 | 0.341 | 0.509 |
| 1970 | 205947 | 133671 | 317302 | 154545 | 131368 | 181813 | 88257 | 0.387 | 0.313 | 0.477 |
| 1971 | 111639 | 72682 | 171479 | 127155 | 107395 | 150550 | 78905 | 0.329 | 0.264 | 0.41 |
| 1972 | 1073335 | 707532 | 1628262 | 128143 | 111460 | 147322 | 266153 | 0.657 | 0.54 | 0.799 |
| 1973 | 310663 | 206659 | 467007 | 125382 | 108183 | 145315 | 322226 | 0.54 | 0.443 | 0.658 |
| 1974 | 65039 | 42241 | 100139 | 153937 | 134375 | 176347 | 221157 | 0.502 | 0.416 | 0.607 |
| 1975 | 59149 | 38437 | 91022 | 194781 | 167105 | 227042 | 175758 | 0.496 | 0.414 | 0.594 |
| 1976 | 59157 | 37549 | 93200 | 195674 | 168190 | 227648 | 137264 | 0.719 | 0.606 | 0.853 |
| 1977 | 120692 | 76059 | 191516 | 118859 | 100310 | 140838 | 110158 | 0.732 | 0.605 | 0.887 |
| 1978 | 213186 | 141614 | 320929 | 80895 | 67101 | 97524 | 95422 | 0.627 | 0.511 | 0.77 |
| 1979 | 160795 | 106373 | 243060 | 62278 | 52461 | 73932 | 103623 | 0.584 | 0.472 | 0.722 |
| 1980 | 23618 | 14727 | 37876 | 62543 | 53210 | 73512 | 87889 | 0.476 | 0.383 | 0.591 |
| 1981 | 11101 | 6634 | 18576 | 72421 | 61374 | 85457 | 77153 | 0.438 | 0.352 | 0.545 |
| 1982 | 16377 | 9962 | 26924 | 68421 | 56732 | 82517 | 46955 | 0.384 | 0.306 | 0.483 |
| 1983 | 8039 | 4650 | 13898 | 58508 | 48149 | 71095 | 24600 | 0.348 | 0.273 | 0.445 |
| 1984 | 13082 | 7978 | 21453 | 53166 | 43434 | 65078 | 20945 | 0.314 | 0.243 | 0.406 |
| 1985 | 357657 | 235975 | 542084 | 49030 | 40833 | 58873 | 45052 | 0.399 | 0.314 | 0.508 |
| 1986 | 476527 | 315596 | 719523 | 54603 | 46371 | 64296 | 100563 | 0.537 | 0.428 | 0.673 |
| 1987 | 92051 | 59718 | 141890 | 77211 | 66119 | 90163 | 154916 | 0.632 | 0.509 | 0.783 |
| 1988 | 39771 | 24957 | 63379 | 79561 | 67118 | 94310 | 95255 | 0.513 | 0.412 | 0.638 |
| 1989 | 27846 | 17231 | 44999 | 84262 | 69611 | 101996 | 58518 | 0.372 | 0.295 | 0.467 |
| 1990 | 36089 | 23201 | 56137 | 86042 | 70285 | 105332 | 27182 | 0.211 | 0.166 | 0.269 |
| 1991 | 107694 | 75940 | 152726 | 100226 | 84352 | 119086 | 36216 | 0.239 | 0.191 | 0.299 |
| 1992 | 317850 | 227133 | 444801 | 110116 | 95315 | 127214 | 59922 | 0.296 | 0.239 | 0.367 |
| 1993 | 812363 | 593836 | 1111307 | 123913 | 109413 | 140334 | 82379 | 0.321 | 0.262 | 0.393 |
| 1994 | 389416 | 316627 | 478938 | 154765 | 138530 | 172902 | 135186 | 0.376 | 0.311 | 0.454 |
| 1995 | 99474 | 78314 | 126352 | 190437 | 170166 | 213122 | 142448 | 0.305 | 0.257 | 0.363 |
| 1996 | 98946 | 78328 | 124993 | 216671 | 193990 | 242004 | 178128 | 0.374 | 0.319 | 0.438 |
| 1997 | 118812 | 94279 | 149730 | 186707 | 166912 | 208851 | 154359 | 0.454 | 0.385 | 0.535 |
| 1998 | 63028 | 49180 | 80776 | 129431 | 114942 | 145745 | 100630 | 0.457 | 0.384 | 0.544 |
| 1999 | 147657 | 118952 | 183289 | 94302 | 83762 | 106169 | 83195 | 0.465 | 0.387 | 0.56 |
| 2000 | 83270 | 65838 | 105318 | 78990 | 70062 | 89054 | 68944 | 0.342 | 0.281 | 0.417 |
| 2001 | 359701 | 296740 | 436021 | 92264 | 82413 | 103292 | 89640 | 0.371 | 0.309 | 0.446 |
| 2002 | 386866 | 318438 | 469997 | 109407 | 97831 | 122354 | 114798 | 0.355 | 0.296 | 0.426 |
| 2003 | 332712 | 270243 | 409620 | 138630 | 124677 | 154143 | 138926 | 0.43 | 0.364 | 0.507 |
| 2004 | 255646 | 210593 | 310337 | 156676 | 140945 | 174163 | 158279 | 0.396 | 0.337 | 0.465 |
| 2005 | 354171 | 293454 | 427450 | 166277 | 149640 | 184763 | 158298 | 0.412 | 0.351 | 0.482 |
| 2006 | 153663 | 125409 | 188283 | 151767 | 136561 | 168666 | 153157 | 0.376 | 0.319 | 0.443 |
| 2007 | 514191 | 423913 | 623695 | 153081 | 138058 | 169738 | 161525 | 0.394 | 0.334 | 0.465 |
| 2008 | 1048186 | 874520 | 1256339 | 161015 | 144262 | 179714 | 155604 | 0.325 | 0.273 | 0.387 |
| 2009 | 982329 | 820791 | 1175658 | 181636 | 162878 | 202555 | 200061 | 0.27 | 0.227 | 0.321 |
| 2010 | 235386 | 192881 | 287259 | 246977 | 221307 | 275624 | 249200 | 0.254 | 0.215 | 0.3 |
| 2011 | 117342 | 93736 | 146894 | 356055 | 319054 | 397348 | 309785 | 0.267 | 0.228 | 0.311 |
| 2012 | 331422 | 272529 | 403041 | 467020 | 415602 | 524800 | 315627 | 0.229 | 0.195 | 0.269 |
| 2013 | 117064 | 93785 | 146122 | 509013 | 451179 | 574260 | 193744 | 0.153 | 0.129 | 0.182 |
| 2014 | 399947 | 330282 | 484305 | 510434 | 455625 | 571837 | 177522 | 0.159 | 0.133 | 0.19 |
| 2015 | 71899 | 56805 | 91002 | 488941 | 440830 | 542304 | 194756 | 0.194 | 0.163 | 0.231 |
| 2016 | 206289 | 167949 | 253382 | 479940 | 433696 | 531114 | 233183 | 0.267 | 0.226 | 0.315 |
| 2017 | 191476 | 156175 | 234757 | 402555 | 365961 | 442809 | 227588 | 0.356 | 0.303 | 0.419 |
| 2018 | 353237 | 288706 | 432191 | 296733 | 269095 | 327210 | 191276 | 0.414 | 0.353 | 0.487 |
| 2019 | 774629 | 643003 | 933201 | 225698 | 204447 | 249158 | 175402 | 0.452 | 0.382 | 0.535 |
| 2020 | 414489 | 341742 | 502721 | 186017 | 168034 | 205924 | 182468 | 0.479 | 0.405 | 0.567 |
| 2021 | 153939 | 123568 | 191774 | 170620 | 153632 | 189487 | 204743 | 0.495 | 0.419 | 0.584 |
| 2022 | 44626 | 33640 | 59199 | 167259 | 147656 | 189465 | 176906 | 0.424 | 0.353 | 0.509 |
| 2023 | 164015 | 130651 | 205900 | 170118 | 146693 | 197283 | 178899 | 0.45 | 0.365 | 0.556 |
| 2024 | 469037 | 372117 | 591201 | 150433 | 120071 | 188471 | ||||
References
Howell et al. 2024. Report of the Joint Russian-Norwegian Working Group on Arctic Fisheries (JRN-AFWG). IMR PINRO 2024-7. https://www.hi.no/hi/nettrapporter/imr-pinro-en-2024-7
ICES. 2015. Norway and Russia request to ICES for revised advice for Haddock in Subareas I and II. In Report of the ICES Advisory Committee, 2015. ICES Advice 2015, Book 3, Section 3.2.3.1. 9 pp. http://www.ices.dk/sites/pub/Publication%20Reports/Advice/2015/Special_Requests/Norway_Russia_had-arct_update.pdf .
ICES 2016. Report of the second Workshop on Management Plan Evaluation on Northeast Arctic cod and haddock and Barents Sea capelin (WKNEAMP-2), 25-28 January 2016, Kirkenes, Norway. ICES CM 2016/ACOM:47, 76 pp.
JNRFC. 2016. Protocol of the 46th Session of the Joint Norwegian–Russian Fisheries Commission, 17–20 October 2016 (In Russian). 117 pp. Available at: http://www.jointfish.com/rus/content/download/502/6357/file/46-russisk.pdf .
ICES. 2020. Benchmark Workshop for Demersal Species (WKDEM). ICES Scientific Reports, 2:31. 136 pp. http://doi.org/10.17895/ices.pub.5548 .